Excel Designer
Getting Started
Introduction
This tool helps “translate” the output of the ERP system from “made to be printed” format to logical “tables” – with one header line only and different columns with well-defined data types (most common application is Excel). In the following manual, we will discuss the way to design reports to allow easy conversion of reports to table format.
Most reports can automatically be transferred to table format with no additional human intervention needed. For some reports, additional information needs to be given to B2Win Suite in order to allow better conversion into tabular mode. If you have sub-headers along your report, or a strange header, or a different delimiter than the standard “|” (Pipe), it is suggested to use the “Excel Designer” option in order to allow better report conversion. Every report can have a different design per language. Once these designs are built on a sample data report, they can be used every time this same report is run to the B2Win Suite device – streamlining the generation of meaningful table format reports.
Report Types
We categorize three main report types. First, “Standard reports” that have a clear header, aligned detail lines and a common delimiter, which can be automatically imported to table format. On the other hand, “Non-standard reports” miss one of the characteristics of Standard reports, and may include sub-headers and sub-totals in the report. Non-Standard reports need to be customized in order to be converted to tabular mode. Third type of report is “Transpose reports”, which have titles on every line and the data in front of the title line. These reports need customization and must be “transposed” in order to convert them properly to table format.
Tabular – Standard
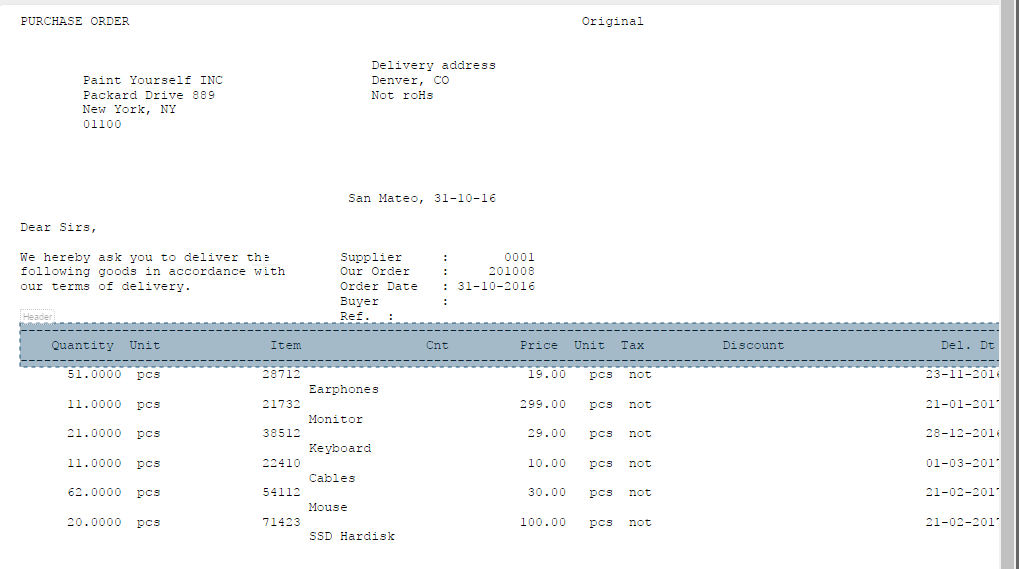
The following is the definition of Standard Report that can automatically be imported into table format using B2win Suite smart automatic engine – without the need of the Excel Designer.
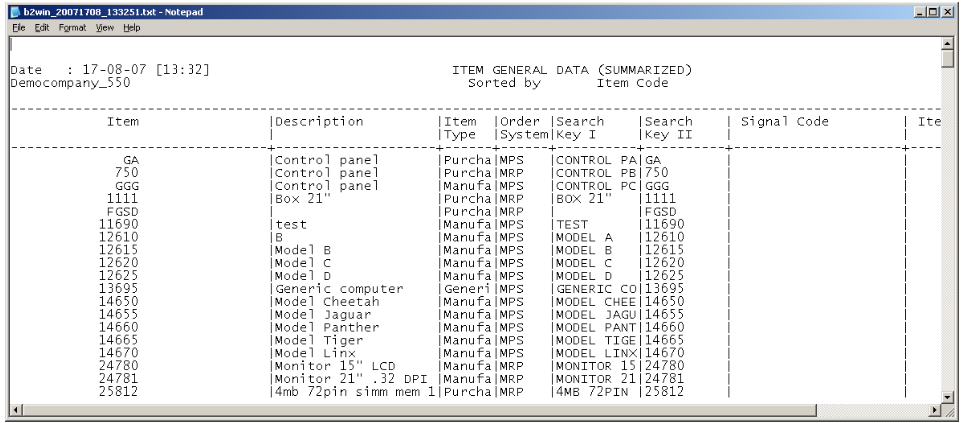
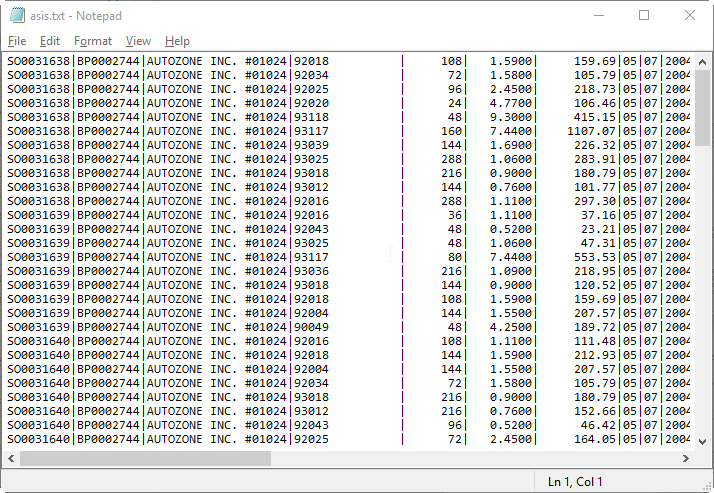
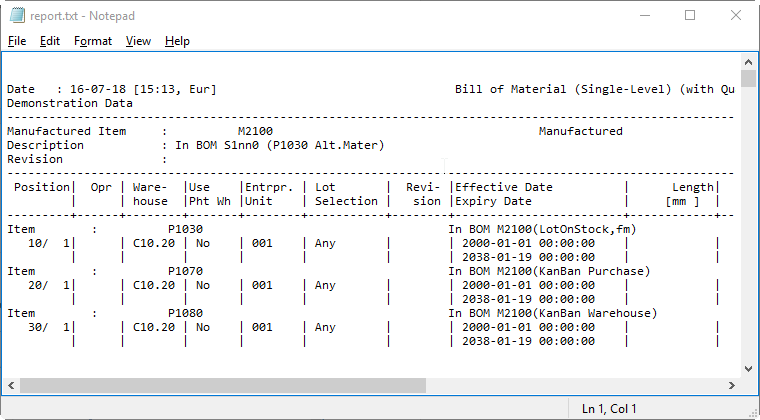
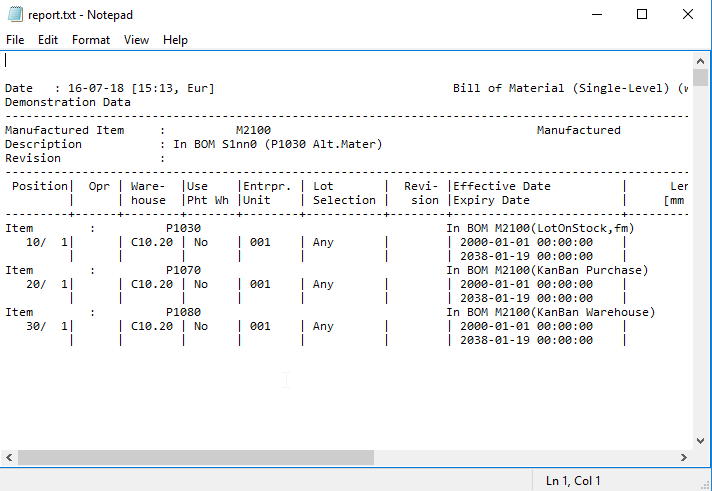
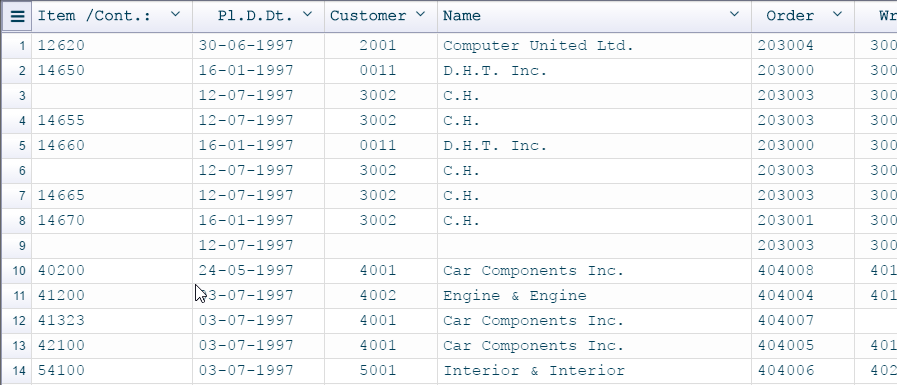
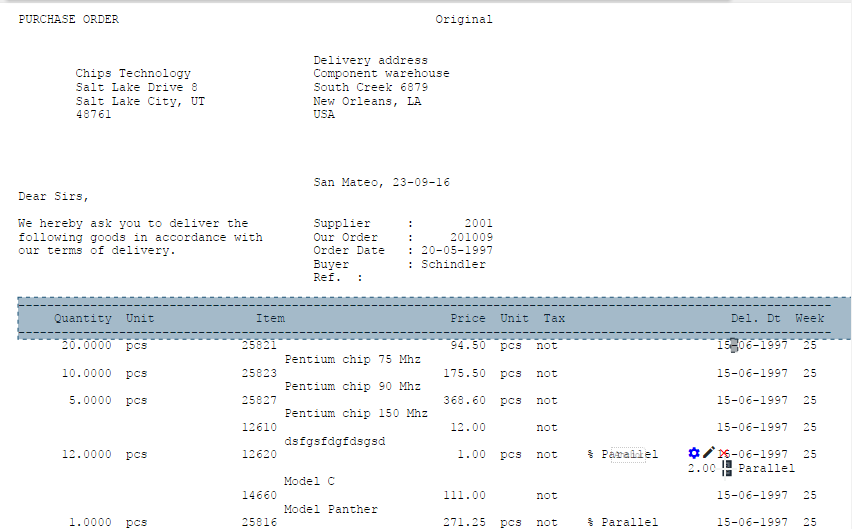
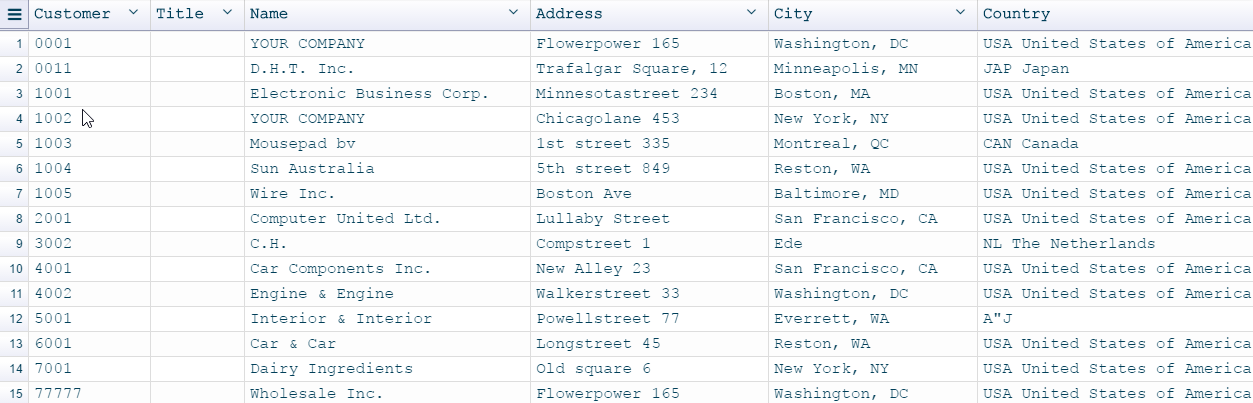
An example of Standard report:
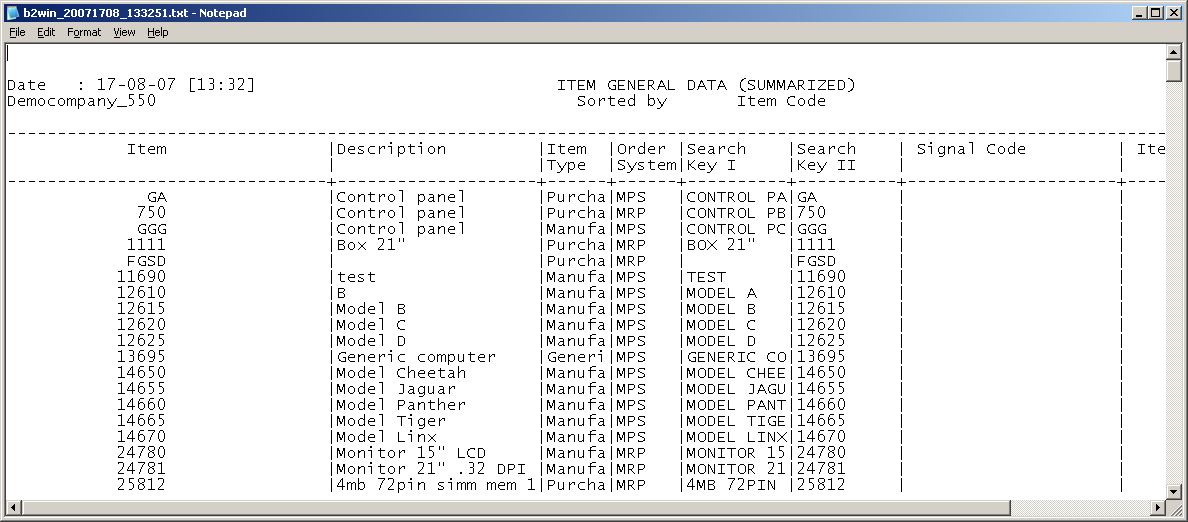
A report is a Standard Report when the following conditions are fulfilled:
- The report delimiter is pipe and it appears in the header lines as well as in the detail lines
- These are two lines of dashes; one before the main header and one after it.
- The main header (as defined here) appears in every page, exactly in the same lines.
- The main header does not contain more than 3 lines (excluding the two dash lines)
- Columns in the report must be aligned, you can see this by looking at the delimiter if it’s all the way in the same position, and makes a horizontal line.
Tabular – Non-Standard
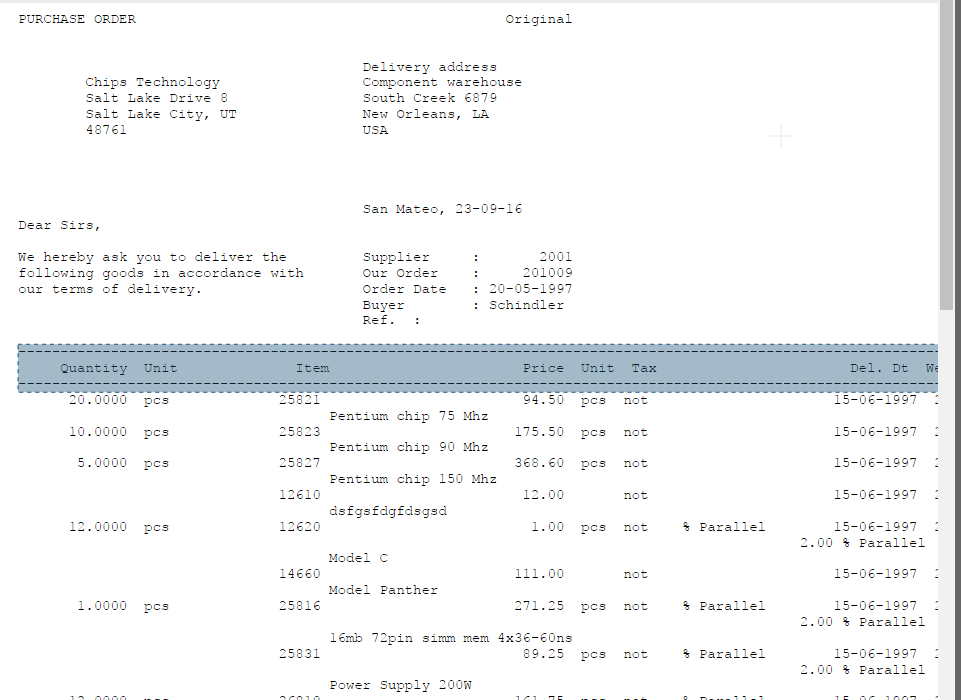
A report is “Non-standard” if any of the five characteristics of “Standard Report” is not fulfilled. This is also the case when a report contains additional data, like another sub-header above the main header, lines inside the tabular data, like sub-headers, totals and subtotals – or when the main header appears in different positions in every page.
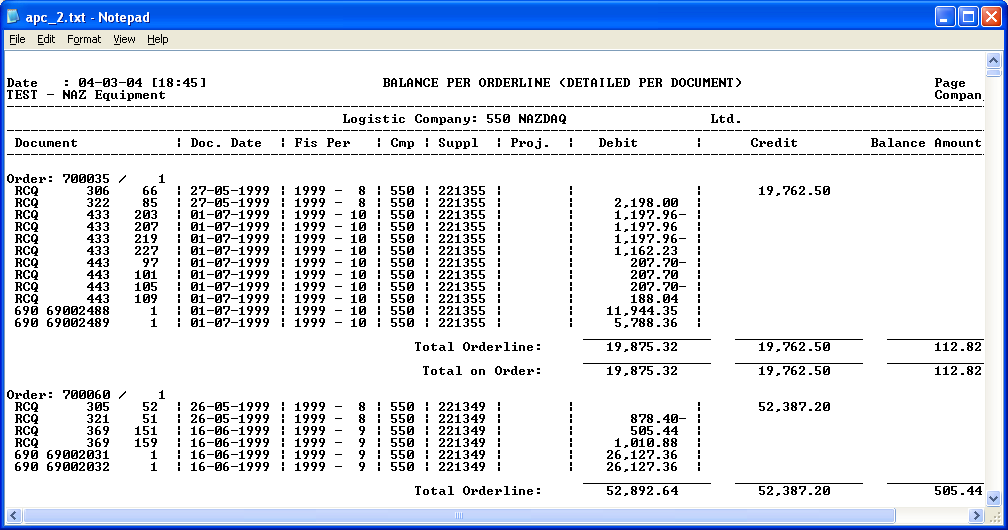
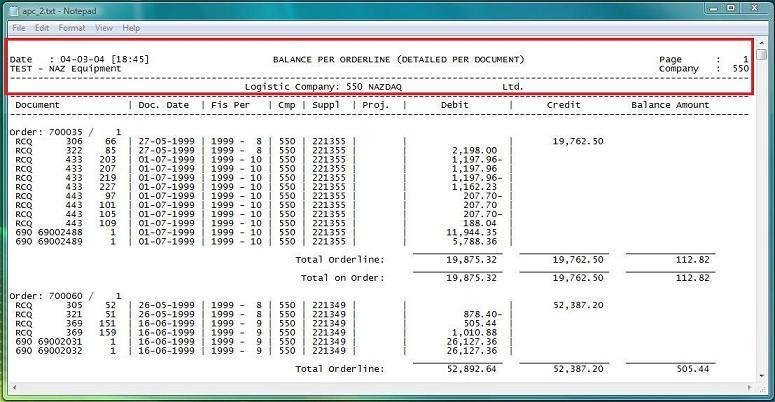
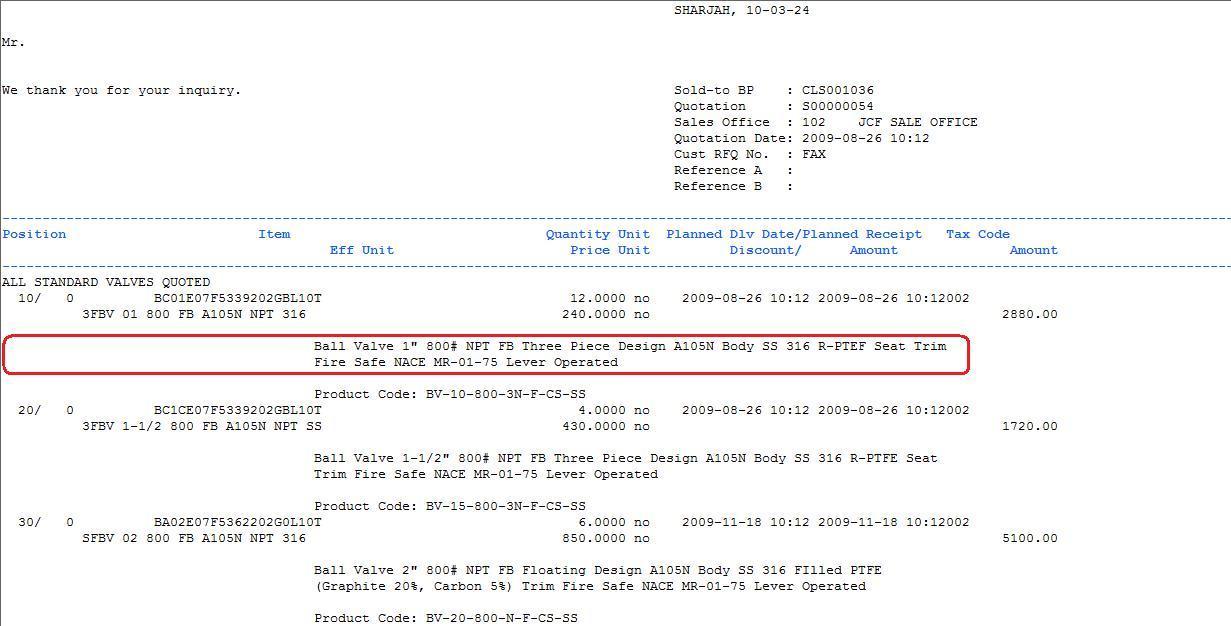
In the following example there is more than one reason this report is not standard.
-
Having an extra line above main header
-
Order number inside table
-
Total Order line and Total on order makes it non-standard
Non-Standard reports can be converted to table format, after designing the output in the Excel Designer.
Transpose
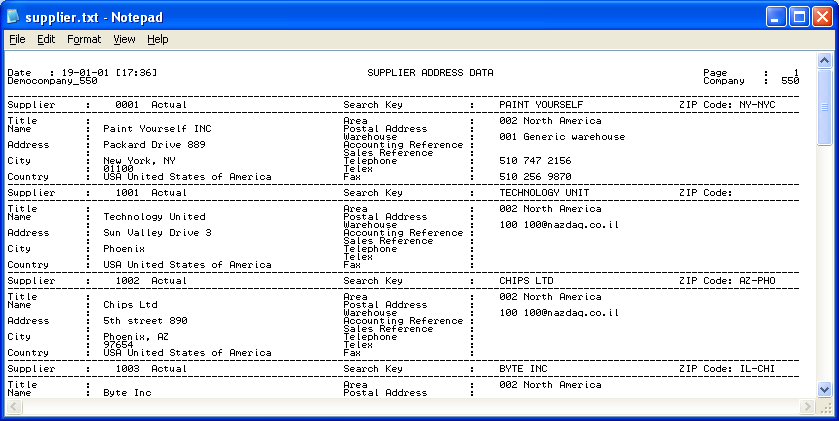
In this report data is represented in rows. A header in the first few lines includes few key fields and the report is organized in such a way that the field name is written in every line, next to the value of that field. There could be up to 3-4 columns in every report with the same pattern.
Example:
Transpose reports can be converted into table format, after designing the output in the Excel Designer.
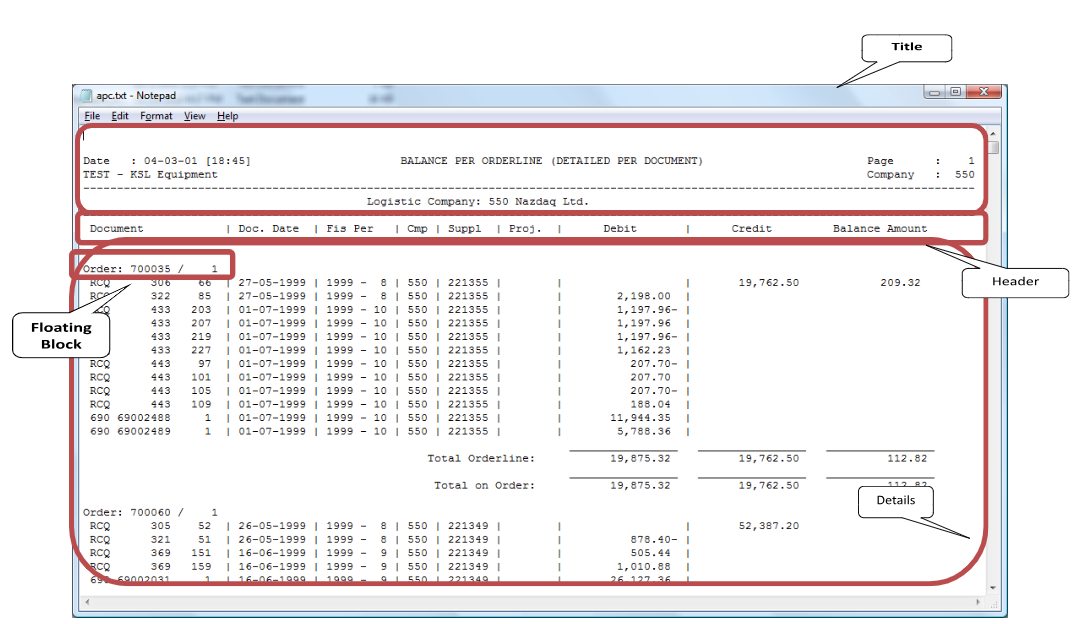
Report Parts
A report according to the Designer can be separated into 4 parts: Title, Main Header, Details and Floating Header Block or Fixed Block.
In the following chapters, we will explain in more detail the different parts and how to handle each one for better design of the report.
How to use this guide
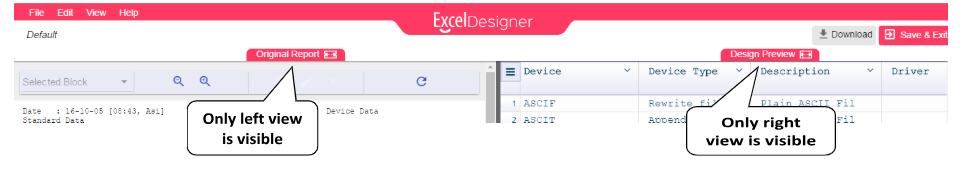
Excel Designer contains two views: Original Report view and Tabular Design Preview.
To switch between these views, use the icons at the left top corner of the screen. You can have both views on screen, or have only one.
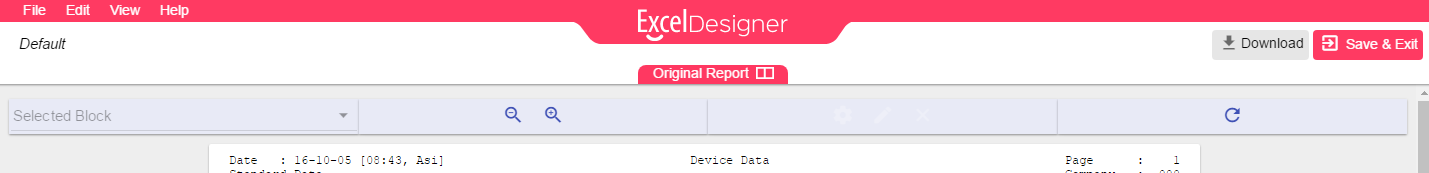
Original Report view
In this view, you find the original input as is, which allows you to mark blocks and set each block as its purpose. You can mark the header, floating headers block or fixed blocks. Set the delimiter or action for each block and all these will take effect in the tabular output view.
We’ll go into details for all blocks types and settings in chapter 2.
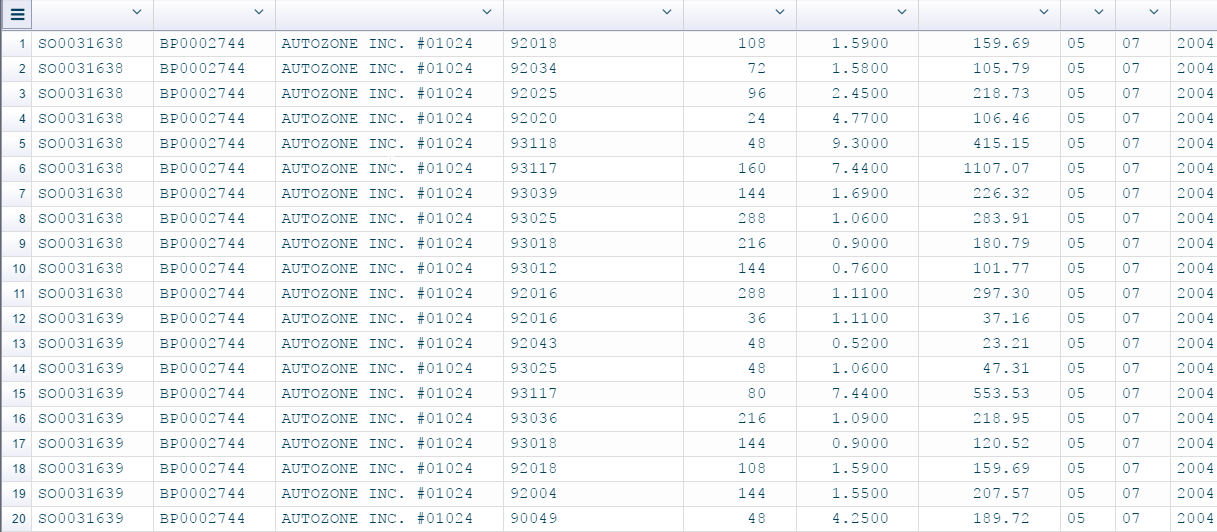
Tabular Design view
This is a tabular view which contains the result of your marking in the Original Input view. Here you can customize your table by working on the columns. You can split, rename, re-order or delete columns. And you can remove trailing or leading spaces, add data type for each column or sort your columns.
We’ll go into details for each of these actions in chapter 3.
At the end the user will have to save this configuration, there are two ways of saving. Both are described in chapter 4.
Original Input View
General
This chapter describes the way to mark all parts of the report in the Original Input view as blocks so we can keep, delete and set each one of them to get the right columns in the result as needed.
In case you have the Excel Designer opened with some previous settings and you need to start your design from scratch then you can click on the menu File -> New, and then all your settings will be removed and you can start a new design.

First you will have to mark blocks which means to select the report parts. Marking blocks is done simply by selecting the text in this view in the right position and then selecting the block type.
There are several types of blocks that will be described in detail in this chapter.
Block General Icons
All blocks have the following action icons, when a block is selected then these icons are enabled for this block. (icons appear in the toolbar and next to the block)
Settings
Open the settings window for the selected block.

Reposition
This option removes the current marking for the selected block and allows the user to mark it in a new position

Delete
Delete the marking of the selected block

Blocks List
All blocks are included in the blocks list located in the toolbar in this view, you can choose any block from the list and as a result it will be selected. This is helpful when you need to locate a block in order to change its settings or delete it or just to find its position in the report.
Block Display Name
You can choose the block name to be displayed in the blocks list in the “Display Name” field in the blocks setting window.
Title
Title is usually on every page and contains all lines from the start of the first page until the main header’s first line. In most cases it’s recognized automatically and removed in tabular result.
Main Header
Introduction
Every report has a header that contains the column names which usually appear in every page. The header will appear only once in the resulting table.
By default, the delimiter between the columns is the “|” (Pipe). You can define a different delimiter in Edit -> Settings -> REPORT
We will go over four types of headers in the following points.
Header Types
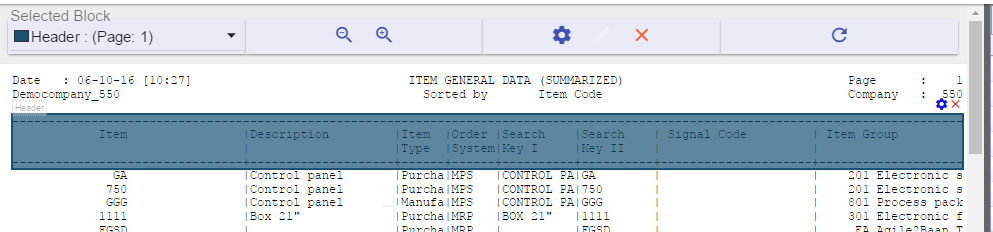
Standard Header
A report contains a standard header that always comes in the same position in each page of the report.
Example:
When customizing a similar report to this one, usually the main header will be auto detected.
Auto detection searches for the first dash line and marks the main header from the first dash line until the second dash line. In some cases, the first dash line is not the start of the main header. In this case we should mark the main header manually.
No Header
Some reports have data in a table with no header. These are usually customized reports.
Example:
In order to define the header type, go to Edit -> Header and choose No Header

If a report is defined as a no header report, columns will be automatically detected.
As the report has no header, column names are empty. You may want to insert column names.
-
Click on the arrow at the right side of the header for the column that you want to rename in the right view. Click rename
-
Insert the column name

Do the same scenario for the rest of the columns as you choose, to have an organized tabular report.
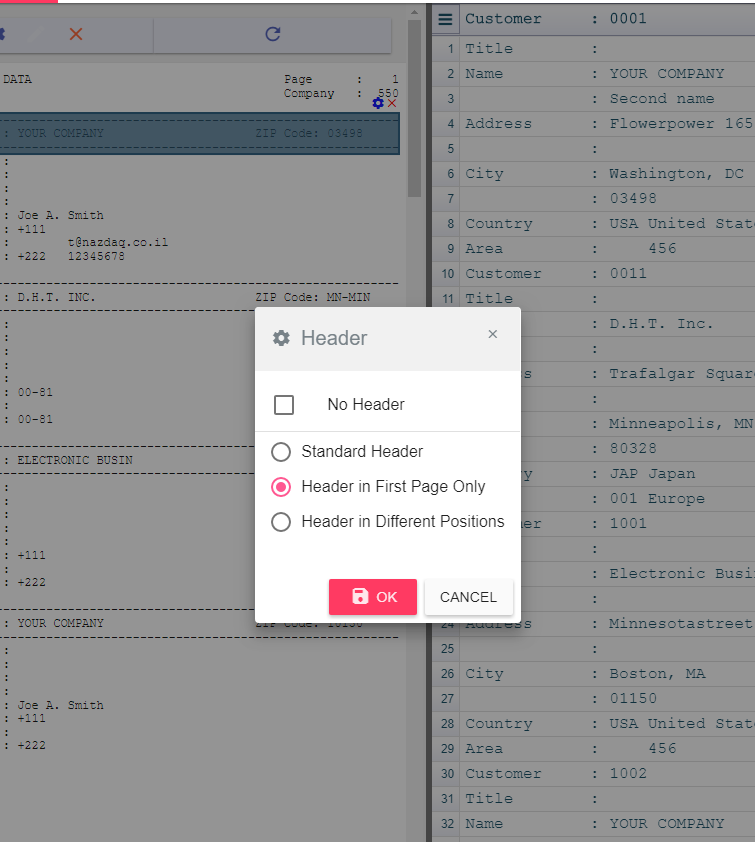
Header in First Page Only
If the report has a header in the first page, while other pages contain data with no header, you need to specify this option.
Header in Different Positions
Sometimes, the header does not appear in the same location in every page, as in the following example:
In the first page:

In the second page:
In this case you need to specify this option so that headers and data are detected correctly.
Usage
Assign Main Header
If the main header is not detected automatically, or if it was mistakenly detected, we
can manually specify the main header.
To set the main header:
-
In the Original Input view of the Excel Designer, mark the header text you want to choose.
-
You’ll get a menu to choose the block type, you need to choose Main Header.

-
In case you already had a main header marked before choosing a new one, then you’ll get the following message

Changing the main header will cause all settings in the output tabular view to be cleared since this action may change the columns structure. Click yes to allow clearing these settings and setting the new main header.
-
To set the main header type you need to select the main header block and click on settings icon.

Remove Main Header
You can remove the main header that was already set by selecting the main header block, then click on the delete icon.
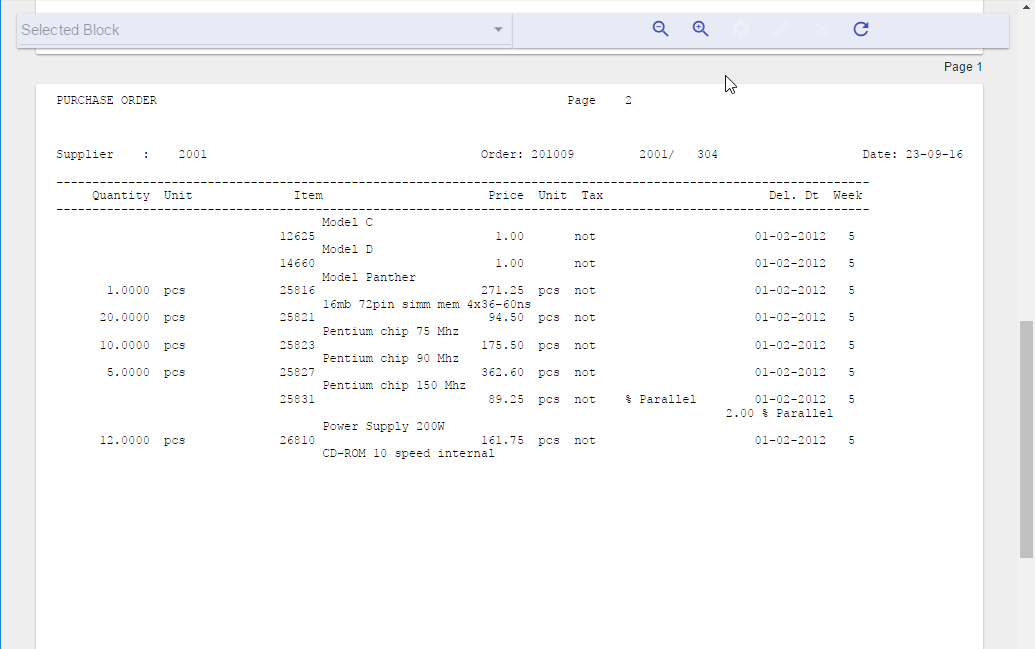
Detail
Introduction
This is the part that comes after the main header until the end of the page. Detail lines are mainly handled in the tabular view.
The delimiter is automatically assigned as “|” (Pipe) unless defined differently in Edit -> Settings -> Report
Detail Settings
You can find it in Edit -> Settings -> DETAIL
Remove Delimited Only Lines
By default, empty lines that have delimiters only (no data, all columns empty) are kept in the resulting table. When choosing this option these lines will be removed from the result.
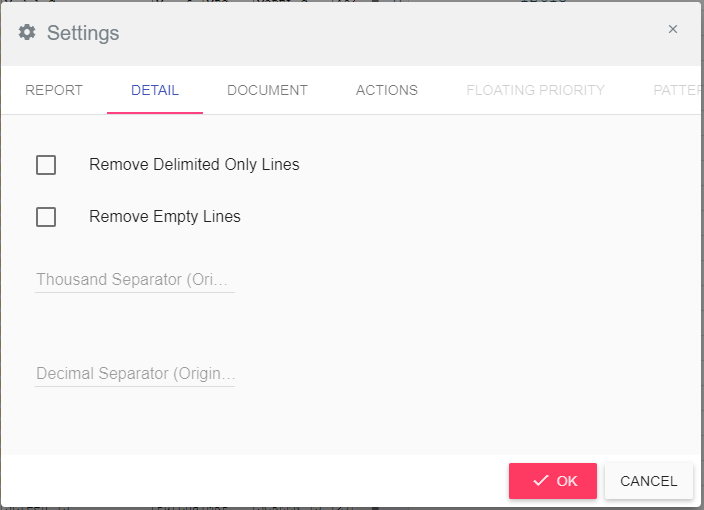
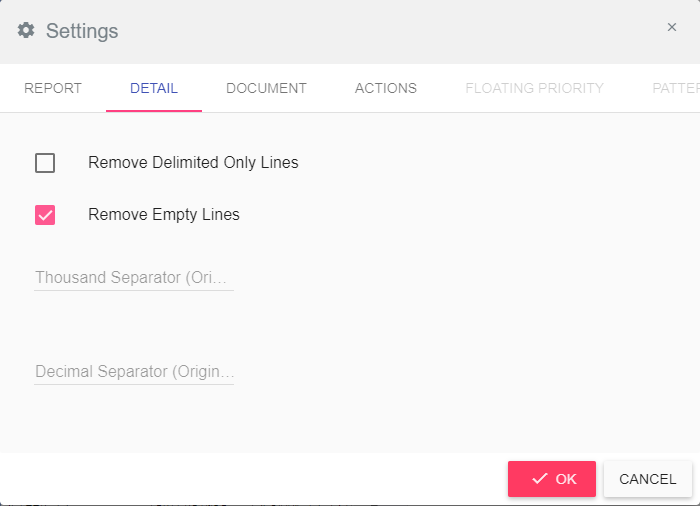
Remove Empty Lines
By default, empty lines are kept in the resulting table. When choosing this option, these lines will be removed from the result.
Floating/Fixed blocks
Introduction
What is a Floating Header Block?
Tabular reports may in some cases have data that does not come in the shape of title, header or detail. These are usually sub-headers, sub-titles or sub-totals. All of these entities are defined as “floating header blocks” and need to have special treatment.
A floating block is an area of two different blocks. Both of them are inside a rectangle and they can appear anywhere in the report.
Each floating block has two parts: label and value. The label is the string key that is needed in order to recognize the floating block. The value is the string that will be associated with the floating label.
What is a Fixed Block?
Fixed block is a certain text area in the report which can be defined single or multi-line inside a rectangle. In any report, it always begins and ends in the same (Line, column) coordinate.
Example:
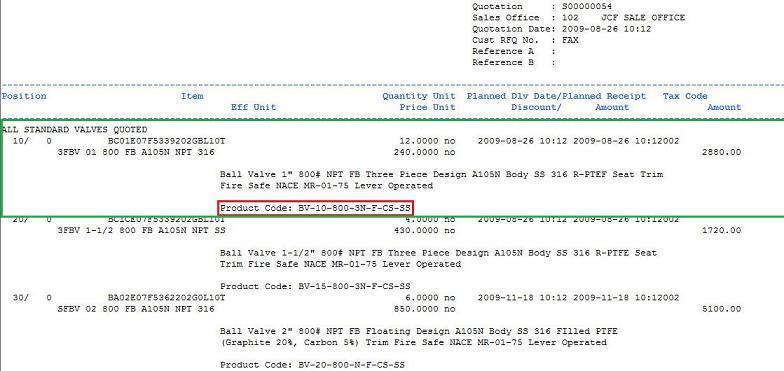
Label
Floating header blocks have two parts: label and value. The label is the string key that will be needed in order to recognize the floating header block. In the above example, the floating label is “Item :”.
Note that a label can’t be multiline.
Value
The value of the floating header block is the changing field related to the floating header block’s label. The first value in the example above is “P1030” but different values may appear towards the rest of the report.
Note that the value may be one line or multiline.
Relation between Label and Value
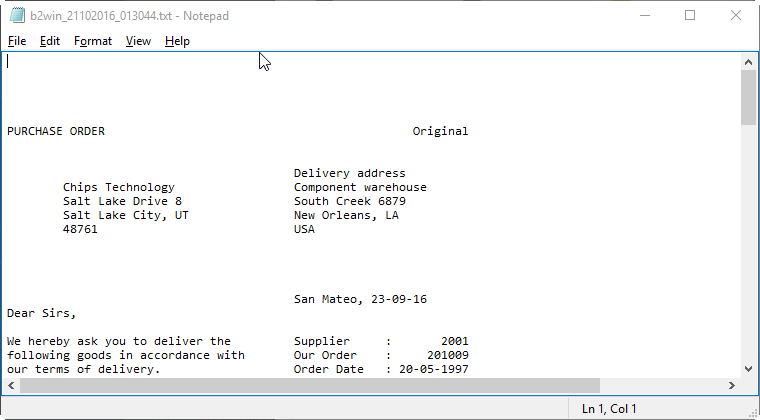
The label and value of a certain floating block may appear on the same line. This is the most common use of floating header blocks.
In more complex scenarios, the label and the value are not next to each other. The rule we need to keep is to have fixed distance between them, in rows and columns.
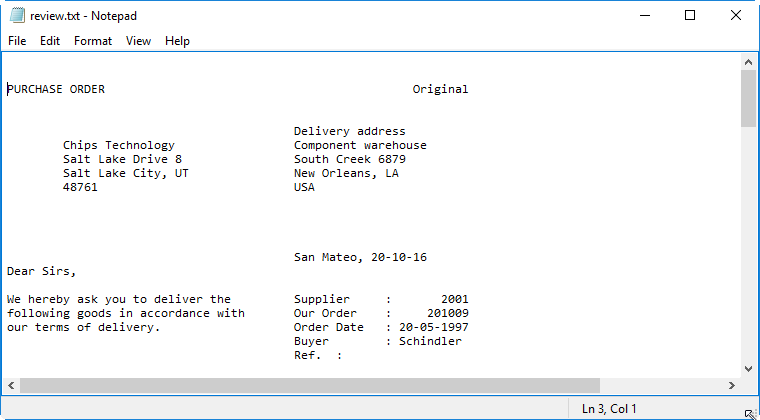
In this report we want the label “Delivery address” (Marked in red) to have the value in a different line (Marked in blue).
Floating Header Blocks Types
Regular Label
This floating block has a label and value where the label’s appearance in the same x coordinate once is the key condition of this type
Label must be of one line while the value may be multi-line.
These are the steps to mark the floating header label and value:
-
Set Floating Header Label: Mark “Item :” and you’ll get the following menu

-
Select “Floating Header (Label)
-
Then you get the following message

-
Mark the Floating Header Value (Marked in blue in the previous screenshot)
Repeated Label
A different type of floating header block is the one where the label is repeated in every line, next to the value, and we have a variable number of lines for this floating block.
Example:
In this report we have the text that appears for every item. The number of lines for each text is variable. We define a floating block with a repeated label of spaces.
-
Mark first spaces that appears before the text and select Floating Header
-
Then mark the first line of the value as asked.
-
Click on the settings icon when current floating block is selected
-
Go to Advanced tab
-
Check the Repeated Label checkbox.
-
Then Choose the number of maximum lines for the block.
After the repeated label has been set, you can set all other floating header options for this block.
Anti Label

Sometimes, it is hard to define a floating block and it is easier to define an anti-label, which means that when the label does not equal a specific term, recognize this as a floating block.
The following is an example:
After you define the space (Marked in red) as the anti-label, go to block settings, the second tab, Advance tab and fill the Anti Label field with “.”
This means that all lines that do not contain “.” in the label position should be recognized with the value marked in blue which is the item description.
Block Action
After you have defined the floating header/fixed blocks properly, you can decide the action you want to perform on each block.
Note that the first two actions are applicable for the floating header block and the fixed block. And the rest of the actions listed are applicable only for the floating header block.
Supported actions are:
Keep
Use this option when you wish to keep the floating header/fixed block (Label and value) in the same place it appears in the result.
Delete
When this option is specified the floating header/fixed block will be removed from all report pages.
Delete Value
This option keeps the label wherever it appears in the original report, and deletes the specified value in all its instances.
Delete Label
This option keeps the value wherever it appears in the original report, and deletes the specified label in all its instances.
Pivot Down (R)
When we specify the option of Pivot Down R (Repeated), the floating header block value will be repeated for all rows that appear after the floating block.
Example:
On the first rectangle for every row, Item value will be repeated
and the same thing for the second rectangle
And the result in the Tabular Output view will be as the following:
Here we see that Item appears in every row with the same value, until another
Item value is found in report
Pivot Down (S)
When Pivot Down S (Single), the value will be assigned to the rows that appear after the floating header block, and will not be repeated, it will appear only once on the first row for detail lines coming after as seen in the following.
This is the Tabular Output view for the previous example in case we change the action of the floating header to Pivot Down (S)
Pivot Repeated for first of detail row only.
Pivot Up
When Pivot Up is used, the value will be assigned to the rows that appear before the floating block, but will be repeated only on the last row for detail lines coming after as seen in the following example report:
Additional Options
Priority
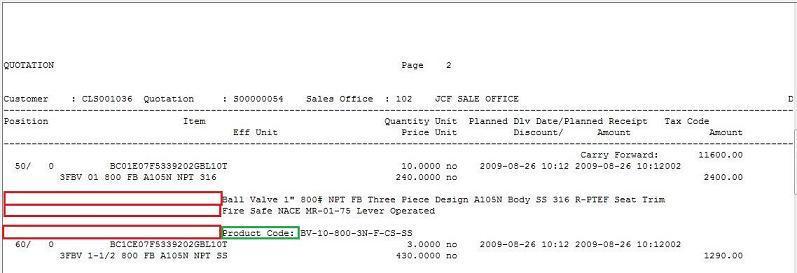
We may have multiple floating header blocks in one report. To avoid conflict and one floating header block “winning” over the other, we can assign a Priority for a floating header block in a report, that causes the customizer to search for the highest priority first – before it handles the lowest priority floating header blocks.
In this example, Red rectangle mark the first label, Green rectangle is the second label
We see that in the second (Green) rectangle, also the first (Red) label answers the same pattern, but our desire is that the green label to be parsed and processed first in these lines.
How to do this in the customizer?
-
Mark the first floating header label (marked in red) and value and set it’s display name to “Desc.”.
-
Mark the second floating header label (marked in green) and value and set it’s display name to “Code”.
-
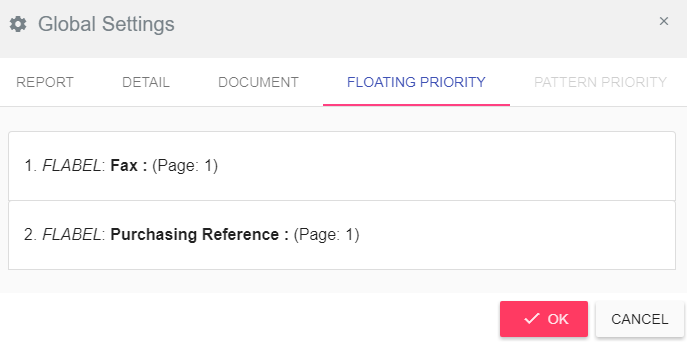
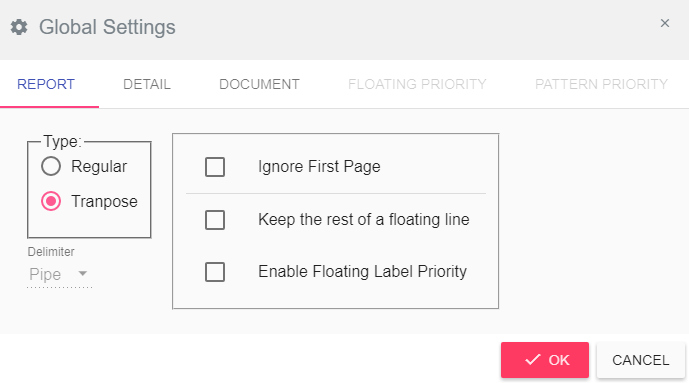
To activate floating header block priority, go to: Edit -> Global Settings, go to the first tab and check the Enable Floating Label Priority.
-
The priority tab will be enabled right then, go to it.
-
And change the priority order by dragging Code to be the first one.
-
Click okay.
Note: if you Enable Floating Label Priority option it will be enabled for all floating blocks set inside this report.
Area
Floating blocks may appear in every part of the report, but we may wish to limit it to a certain part only, in order to avoid conflict.
When you click on the block settings icon, it opens the settings window where you can select the part where this floating/fixed block should appear in the report.
All – in all report parts
Title – only in title (see chapter 3.2 for Title definition)
Detail – only in the detail area (see 3.4 for Detail definition)

If we set a floating header block to be in Detail, and there is a certain match for it inside the Title area, the customizer won’t parse it when it finds it in the Title area.
Keep the rest of a floating line
By default, all characters outside the floating block label and value or fixed block part that are on the same line where the floating/fixed block is active will automatically be deleted in the resulting table. When this option is set, these values will be kept.
Page
Fixed blocks may appear in every part of the report, but we may wish to limit it to a certain page only, in order to handle different report page layouts.
Select a fixed block under and click on the settings icon, there you can select the page where this fixed block should appear in the report.
All – in all the report
First – only in the first page
Middle – only in middle pages
Last – only in the last page

Note that this option applies on fixed blocks only.
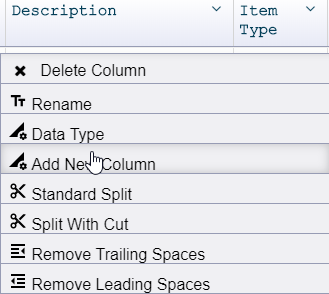
Adding Additional Columns
You can add new columns to the excel file by clicking on the right arrow on the header of the Design Preview screen and then choosing “add new column”
The new column being added can be an excel formula or a new external database variable
Adding an External Database Variable
You are no longer limited with the data that comes from your canned reports. You can now add new columns to your already existing reports in Excel, based on SQL commands that bring additional data from any database (ERP or other), based on values from the report.
One or more columns from your original report will be parameters. You can use these parameters inside the query while fetching new values from the database. The designer will take each row of this column and pass it to the query so you can get a related new value for each row.
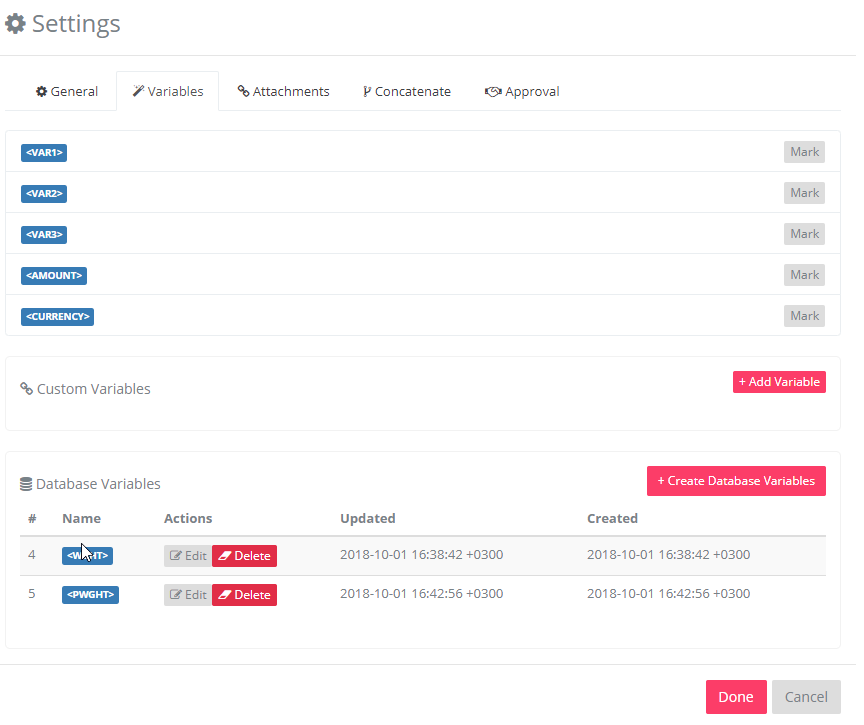
External database variables can be added in the application interface, under the distribution settings in the variable tab like in this example:
Here is an example of a query for a database variable that fetches the weight of the item:
select ttiitm001550.T$wght
from ttiitm001550
where TRIM(ttiitm001550.T$item) = TRIM('<bparam_1>')
In this case the <bparam_1> is set to be the item column in the Excel Designer and so this query will get the weight of the item in each row. This is how the column settings in the Excel designer should be set:
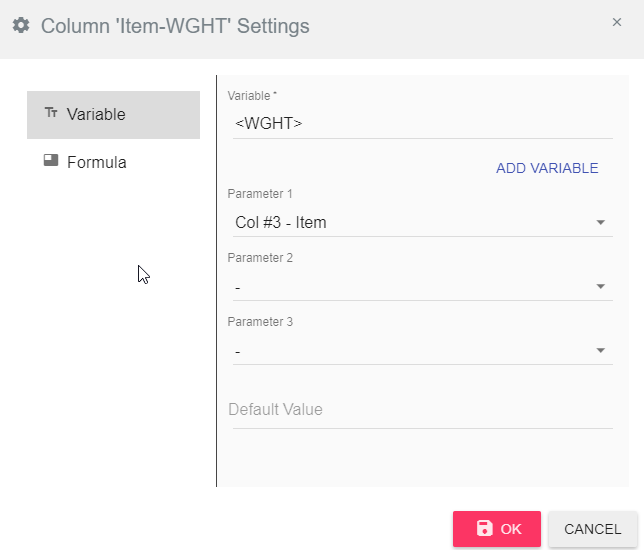
In this interface you can pass other columns as second and third parameters and use them in the query (<bparam_2> and <bparam_3>). The default value field is used in case the query did not return a value (0 for example for numbers).
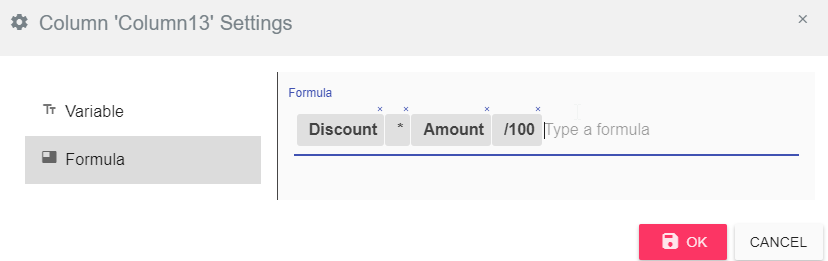
Adding an Excel Formula
You can now add additional columns to your existing ERP reports, based on arithmetic calculations on other columns. This will allow you to produce more meaningful Excel sheets in one click, without the need to perform manual calculations after the Excel sheet was already performed.
When you add an additional column you choose it as an Excel formula. In the formula you can use any of the Excel functions and use the column names. Just start typing and the auto-complete feature will help you. Here is an example:
Multi-Line Detail
Detail lines contain lots of data, generally one line describes one entity/item. But sometimes more than one line can describe one entity, in this case we call it Multi-Line Detail. (Which means a group of lines are related and describe the same entity)
The rectangle contains the data for one item and should be
transformed into one line
In order to be able to insert this data in a tabular result we would like to have all lines for one entity in one line in the table in the second view, and then you can split the columns as needed in the final result.
In the next steps, we will describe the way to set Multi-Line Detail to achieve this goal. We can divide the Multi-Line Detail into two groups as the following
Fixed number of Multi-Line
This is the case were the number of lines in each group of lines in Multi-Line is fixed.
Example:
Each group of Multi-Line has two lines
How to set up this report?
-
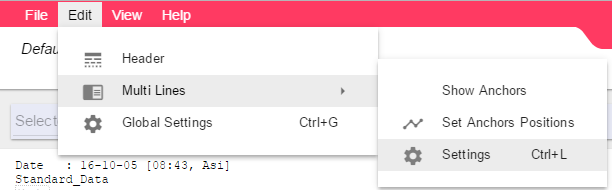
Go to Edit -> Multi Lines -> Settings
-
Check the Enable Feature option.
-
And set the Maximum Lines to 2.

At the end of the settings you’ll get the following message

You need to click on Yes and then all previous settings in the Tabular Output view will be cleared and the new Multi-Line Detail settings will take effect and you’ll see the result in the Tabular Output view.
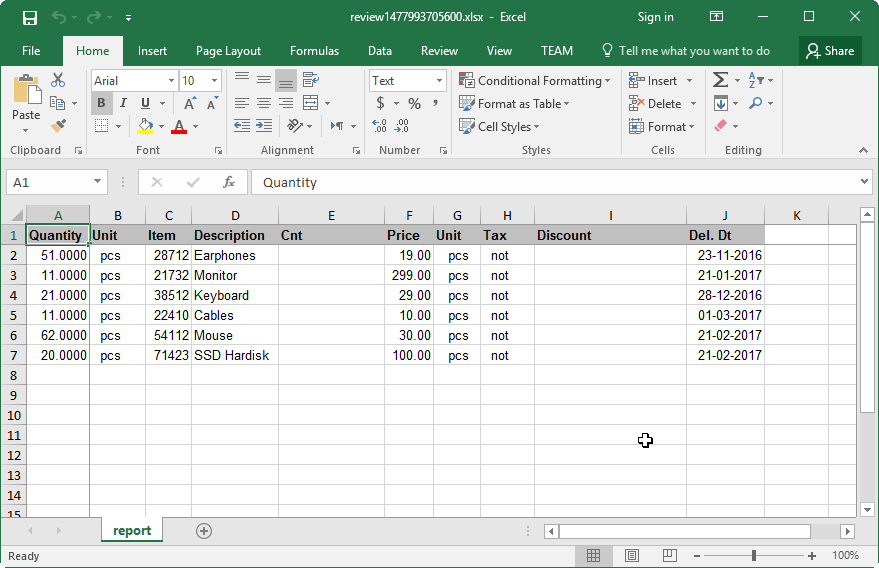
The result in this case is a table with two columns, the first one contains the data in the first line of the Multi-Line group and the second column contains the data in the second line in the Multi-Line group which is the item description.
The first column in the screenshot is resized in order to be able to view the second one
And now you can split the data in the first column and rename the second column and move it next to the Item column to get the following result.
Variable number of Multi-Line
This is the case when the detail is Multi-Line but the number of lines in each group is variable. And in order to find each Multi-Line group we need to be able to find at least the first line in the group. For that we have the anchor which is a character or a group of characters that have to appear in a certain position of the line in order to set this line as the first one in the Multi-Line group.
So, in general the user can set a different anchor for each line in the Multi-Line group.
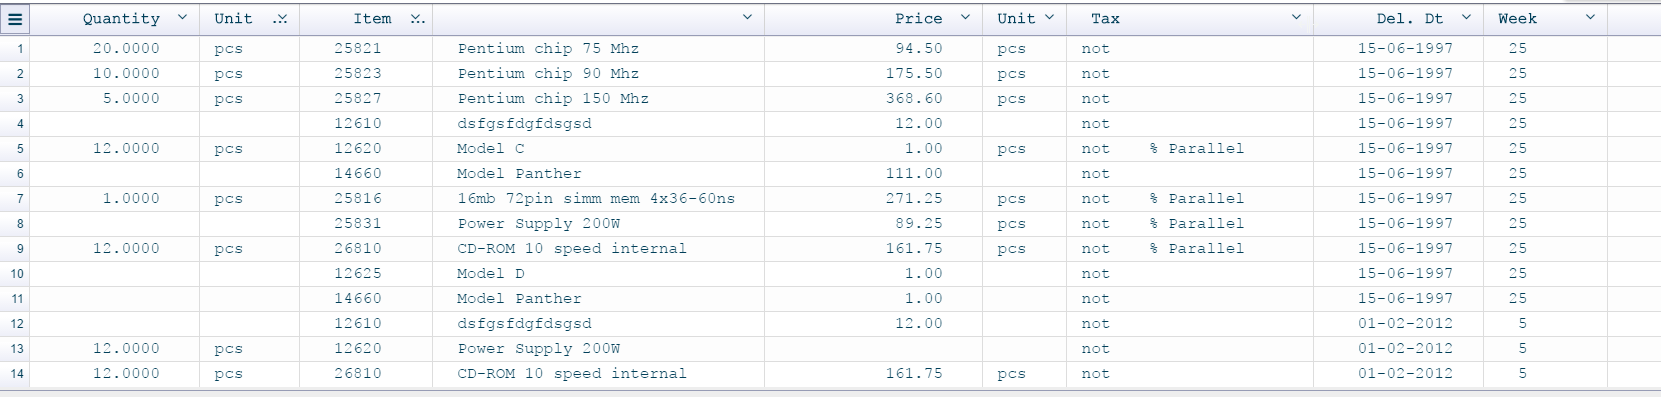
Example:
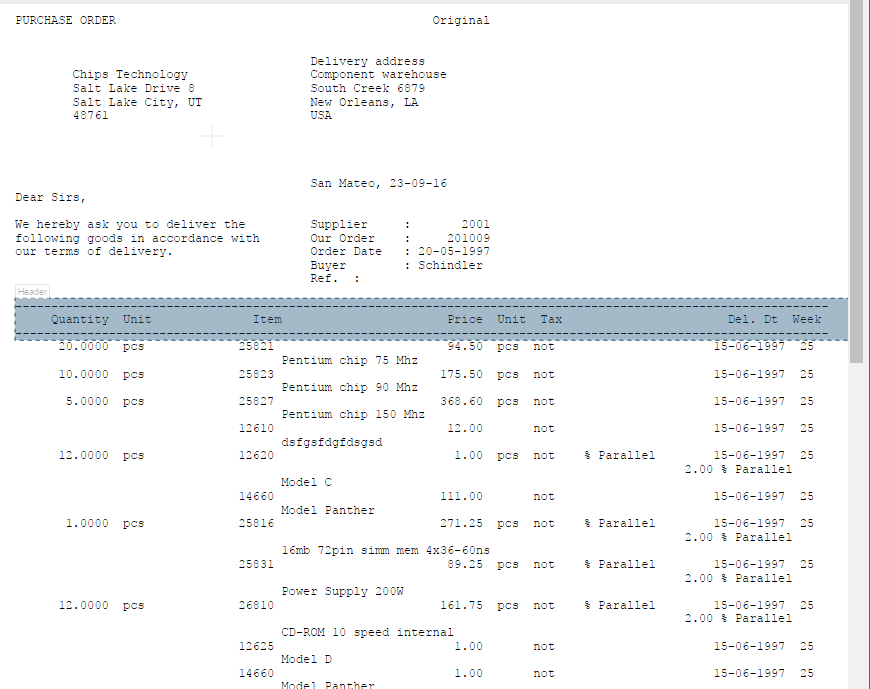
You can see that in group A the second line is actually the third one in group B, and so we need to set an anchor for the first line and another anchor for the second line in this example in order for the customizer to recognize and order the lines in the right column order in the Tabular Output view.
We will show you the steps on how to set up the anchors to get a good result as a table. Follow these steps:
-
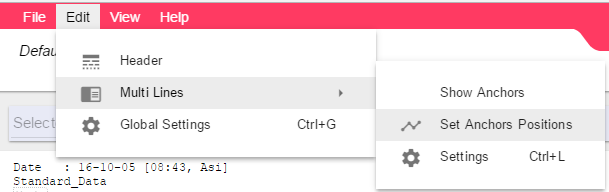
Got to Edit -> Multi-Lines -> Set Anchors Positions
-
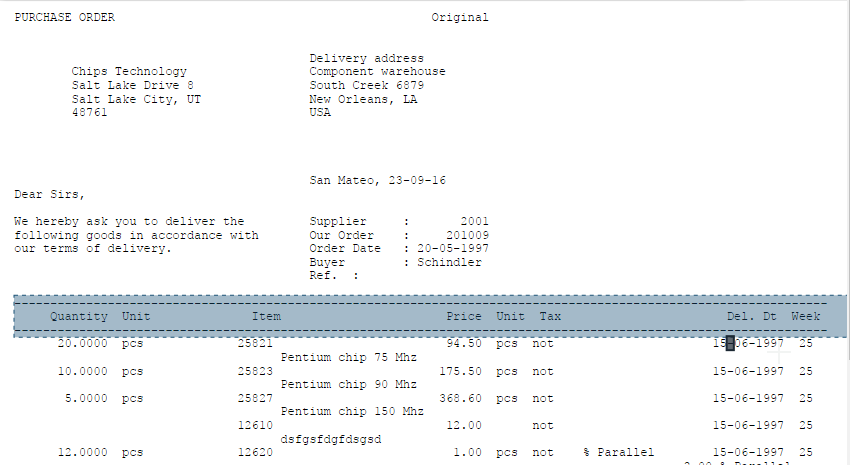
Now you need to choose and mark the anchor in the right position. As in the message

For the first anchor you can mark the “-“ (dash) that appears in the date (last column)
-
You should now mark the second line anchor.

For the second anchor you can mark the “%” sign in the line
-
No need to mark a third anchor since it’s obvious in this example that the third line which doesn’t march the first or the second anchor should be the third line in the Multi-Line group

So, you need to click on FINISH in this above message to get the result in the Tabular Output updated.
-
And now you’ll get three columns in the Tabular Output view.
First column
Second column
Third column
-
You can split the first column, rename the second and the third one. Then reorder the columns to get the result you need.
For example this is the result we got..
Settings
Enable Feature
Check this option to enable the Multi-Line feature for this report. After that you need to set at least one the following, the Maximum Lines or the Anchors.
Maximum Lines
This is the maximum number of lines in the Multi-Line group. When this number is not set then the first anchor must be set so that all lines between each two first anchors are considered one group.
You can find this option in Edit -> Multi-Lines -> Settings

Anchors
You can find a list of all anchors for maintenance in Edit -> Multi-Line -> Settings
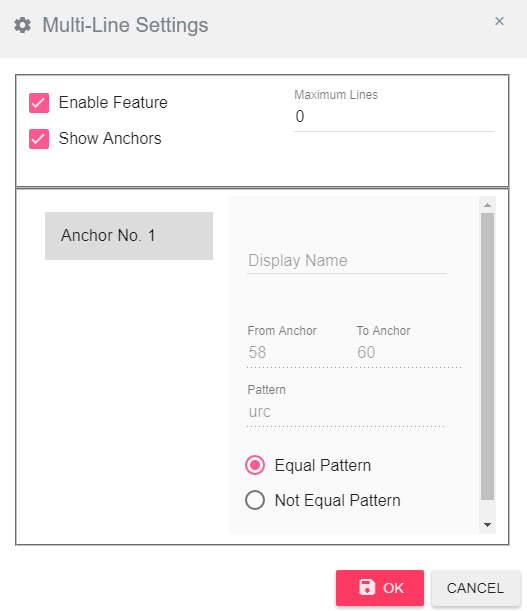
On the left side, you can find the anchors list, choosing one of them allows you to view/edit all its data on the right side of the settings window.
- Display Name – This is the name that will appear for this anchor in the blocks list.
- From/To Anchor – The position and length of the anchor in the line
- Pattern – The pattern that should be compared to find the anchor, it’s by default the selected text from the report, but you change it here.
- Equal Pattern – when selected it means that when the Excel Designer finds the pattern in the from/to position in the detail line then this is a match.
- Not Equal Pattern – when selected it means that when the customizer finds a text in the from/to position in the detail line that is not equal to the pattern then this is a match.
Show Anchors
This option to show/hide the anchor blocks in the Original Output view
Transpose
Introduction
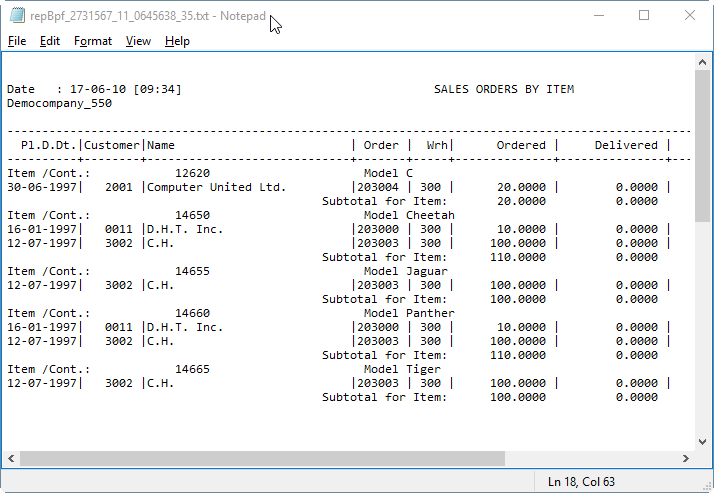
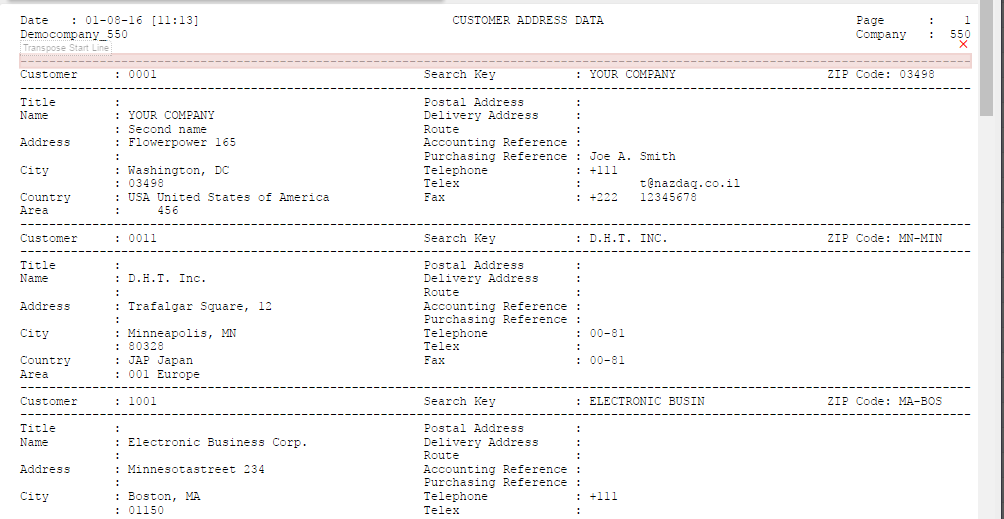
Some reports are line reports (the data is not in columns) and need to be converted to Excel as columns, as in the following example:
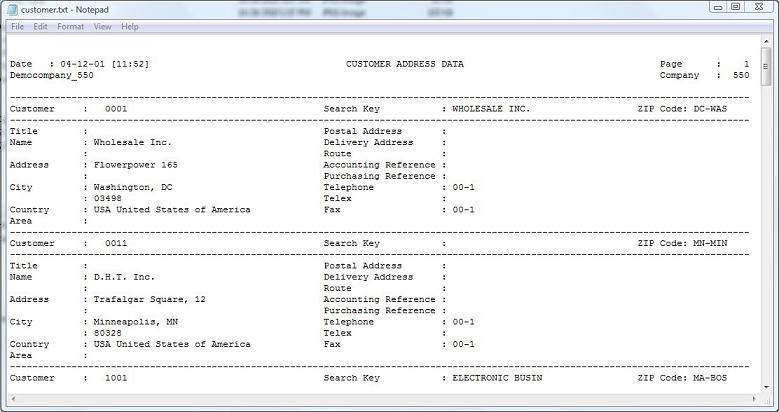
To configure this report in the customizer:
-
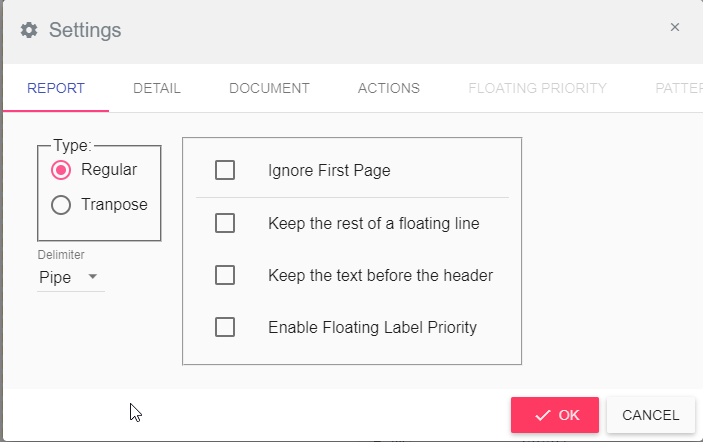
Go to Edit -> Global Settings, and choose Transpose in the first tab.
Then you’ll get this message which means that all current settings will be removed and you’ll have to start customizing the report from scratch.

-
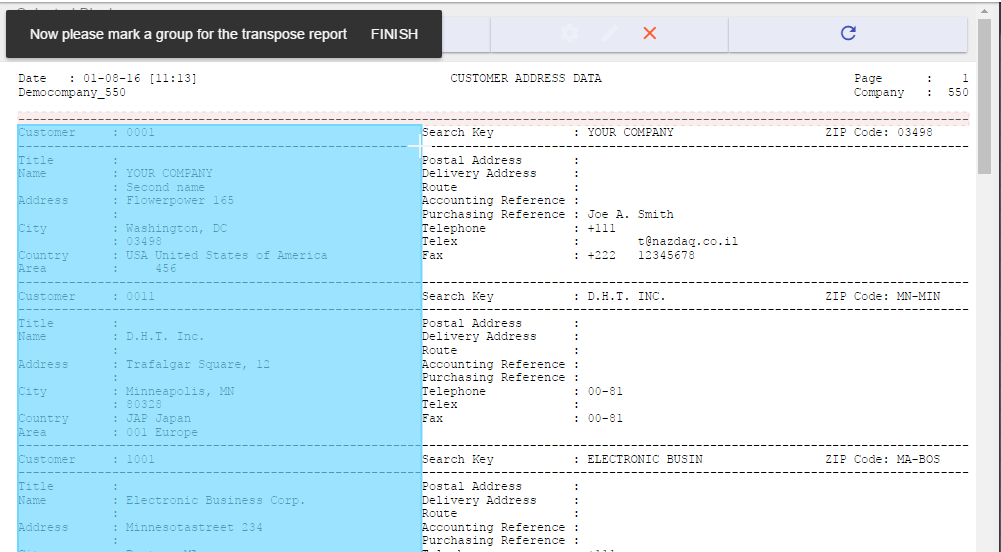
After that, you’ll get the following message to mark the first line of data (including the dash-line)

-
Then you’ll get this message

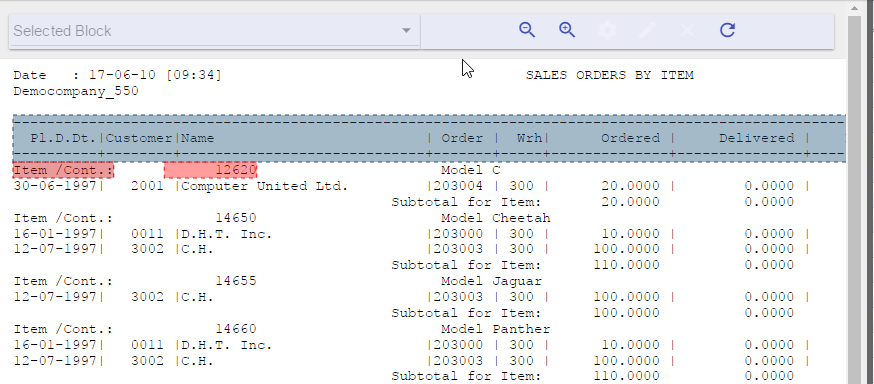
In the following example, you can see that in one line there should be three columns, thus you should group part of the lines as a column, and then all the lines underneath will be grouped automatically (each group will be colored in a different color only in first page, but all the data will be converted)
Assign the first column grouping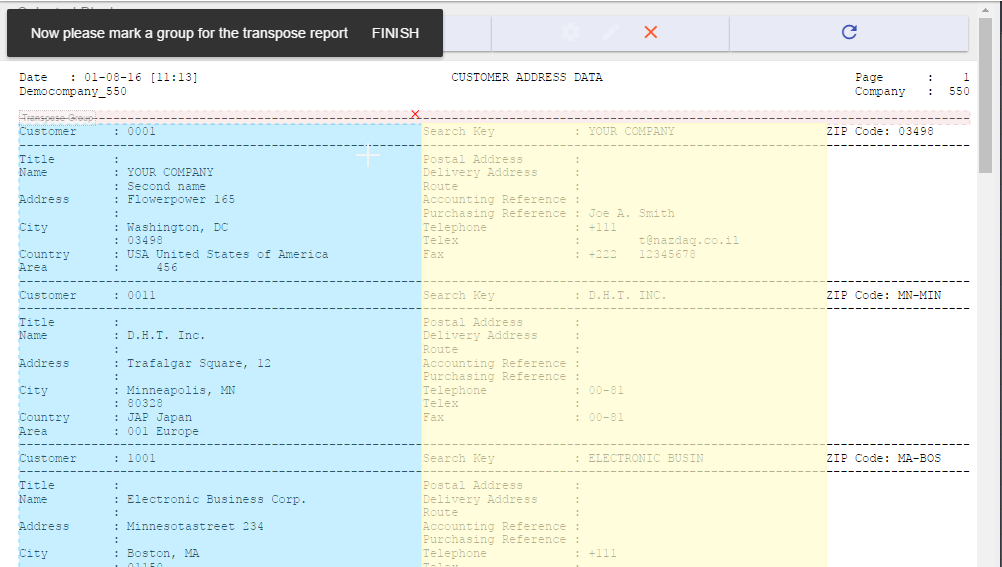
Assign the second column grouping
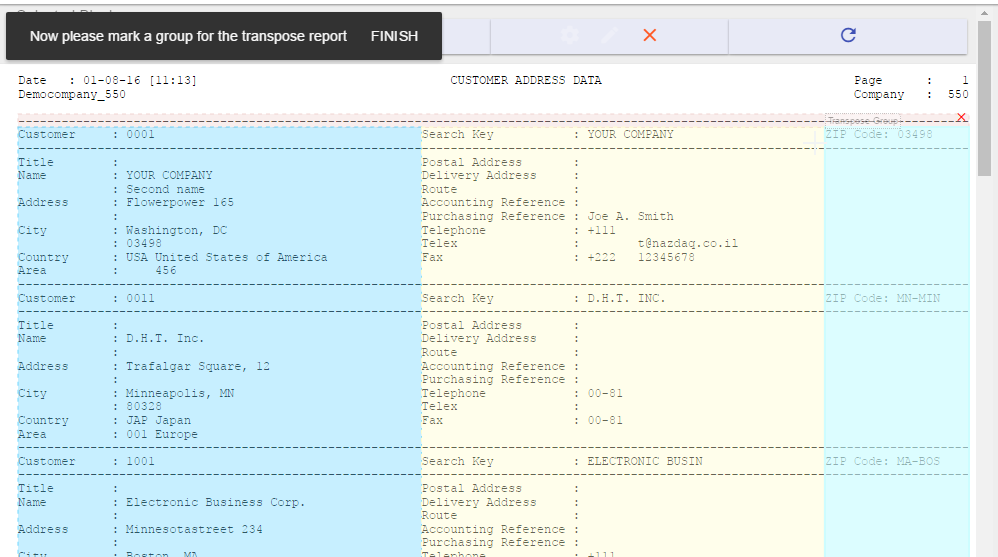
Assign the third column grouping and click on FINISH -
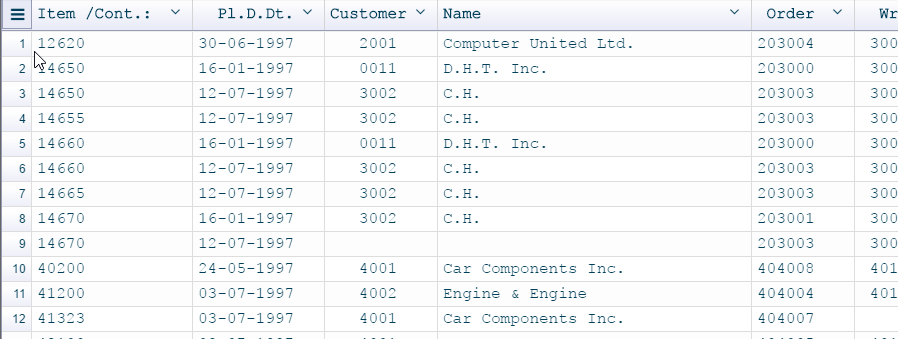
After you have clicked on FINISH, you’ll see the tabular result in the Tabular Output view (on the right). In the Tabular Output view you can rename and delete any column you want and define data types.
Tabular Output view after setting up the columns grouping
Other Settings
Ignore First Page
Sometimes, first page contains only title (Cover Sheet) and is not repeated in the same way in pages 2 and more.
You can choose to delete this text (first page). And then the Excel Designer will detect columns only from the second page and on..
You can find this option in menu Edit -> Settings, and then go to REPORT tab
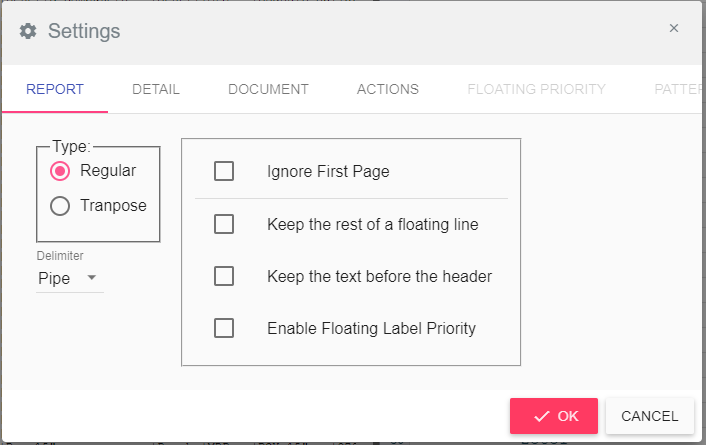
Keep the text before the header
In case you need to keep all sub headers that appear before the main header in the excel result. Then you need to check this option.
You can find this option in menu Edit -> Settings, and then go to REPORT tab.
Font type and size
You may want to choose a different font than the default one used in the excel result. Go to menu Edit -> Settings and then go to the ACTIONS tab to change the font type and size.
Landscape Paper Type
You can set the orientation of the Excel output file from the menu Edit -> Settings and then go to DOCUMENT tab.

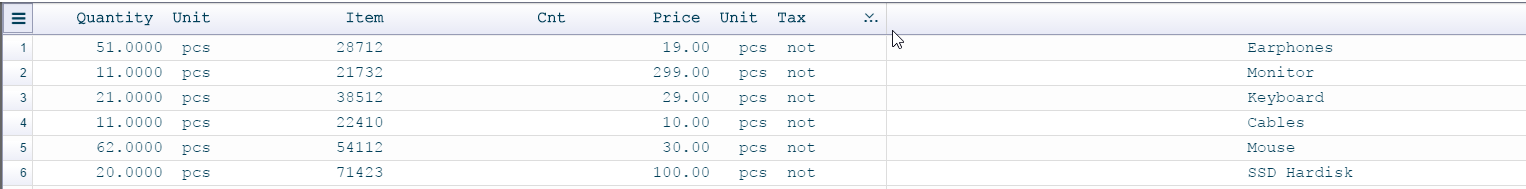
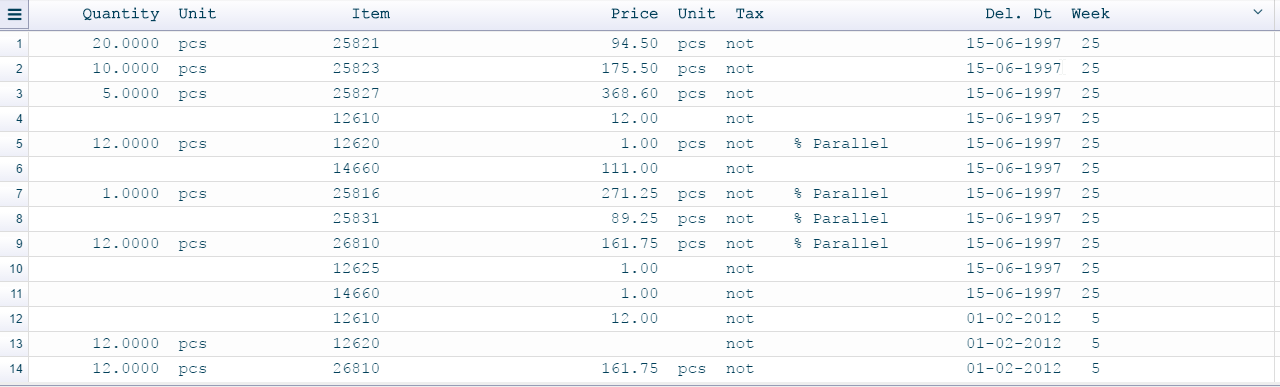
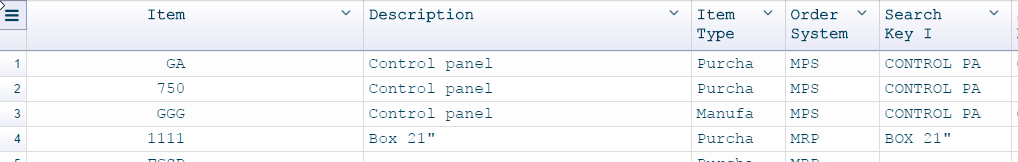
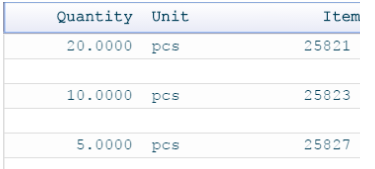
Tabular Output View
This is where you have the table result and you can work on the columns to adjust the output as you need.
In case you need to clear your settings from this view and keep all that was done in the Original Input view, you can click on the menu File -> Clear Tabular. This way all your configuration that was done on the column in the Tabular Output view will be cleared.

While working on your configuration you can check the result in Excel by clicking on Download button at the top right corner of the window which will generate the Excel output according to the current configuration.

In this view, you can perform several actions on the columns, such as delete/undelete, rename, split, reorder, set column data type or remove trailing/leading spaces. You can also choose to sort the data in the table.
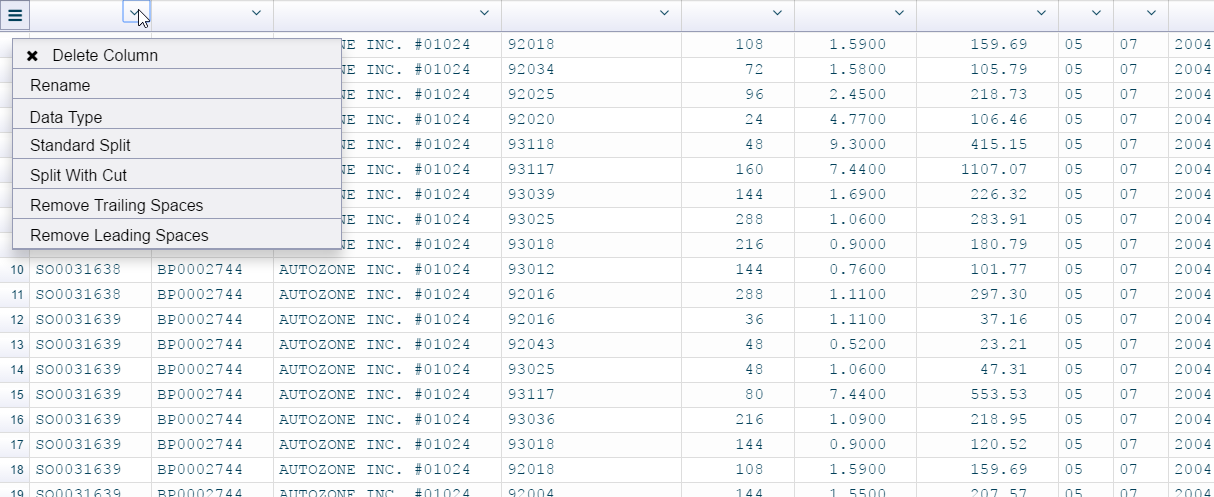
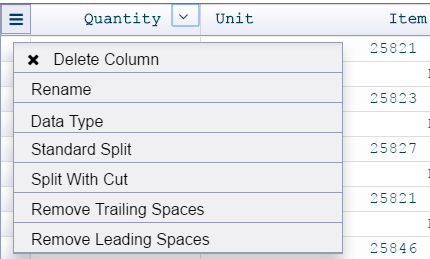
You can find most of these actions either in the Column Menu or in the Table Menu.
-
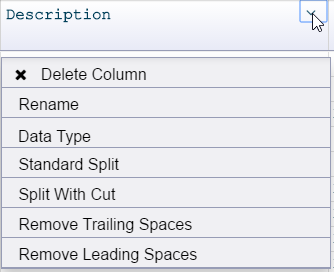
Column Menu - For each column, you’ll find an arrow next to the column header which will open the column menu
-
Table Menu – This is a menu for the whole table, you can open it when you click on the icon at the left top corner of the table.
Delete Column
You can delete any column in the report from the Tabular Output. There are two ways to do so:
- Open the Column Menu and click the Delete Column option.
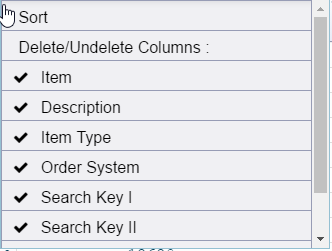
- Open the Table Menu and uncheck the Columns you wish to delete.
Undelete Columns
In the Table Menu under Delete/Undelete Columns you will find all columns’ headers. When you check one of the columns that has the “X” sign next to it, it will be undeleted.
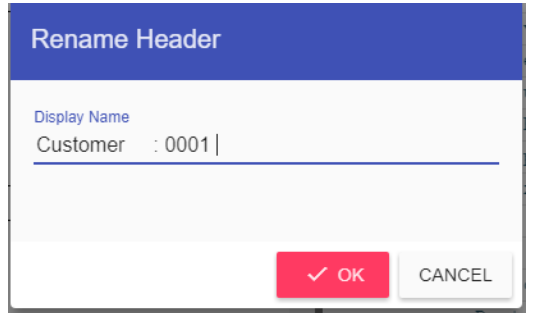
Rename
Renaming a column is as easy as clicking on Rename from the Column Menu, a Dialog should appear, write the new name you want and click on Ok.
Data Type
Using this option, we can force a certain data type for the column data in Excel, instead of relying on the automatic data type assigning.
To select the Data type, click on the Column Menu and choose the Data Type option. Then choose the data type you wish and click on done.
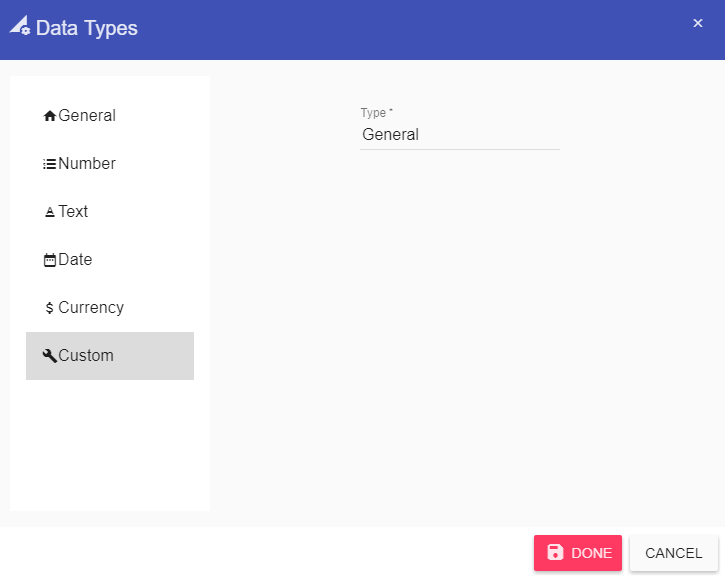
Note: if you wish to select another datatype than the one that appears in the datatype modal, you can add it in the custom tab.
Split - (Standard or with Cut)
Some reports don’t have delimiter between columns or have spaces between them, these columns won’t be split automatically, so the user must split it manually. You can find the split option in the Column Menu.
There are two w of Splitting:
-
Standard Split – Split a column into two columns, without removing any data from the columns.
-
Split with Cut – Splits two columns while removing the delimiter character (wherever the split bar was clicked).
To Split a column into two derived columns:
- Open the Column Menu and choose Standard Split or Split With Cut.
-
If you pass the mouse cursor on the table you can see a vertical line passing with it, select the place you want to split and click on the mouse left button.
Note: (Right click) or (ESC button) cancels the split line

- After you split the two columns you can select each one of them and change its data Type, rename column title …
Remove Trailing/Leading Spaces
Leading and Trailing Spaces are kept by default. For each column in table, we can specify these two options:
-
Remove Trailing Spaces – Spaces after the value will be removed
-
Remove Leading Spaces – Spaces before the value will be removed
Note: Option remove trailing and leading spaces are not displayed in the Tabular Output view - user can only see it when converting the report later on or by clicking on the Preview button.
Sort
You can sort the data in the table by different options, this will affect the data being displayed sorted in Excel. To do so, click on the Sort option under the Grid Menu
To Activate Sorting:
- Sort By: Sort by three columns at once
- Ascend/ Descend: For each column, you want to sort by it, you can specify if Ascending or Descending
- Case Sensitive: Will cause the data to be sorted into Small and Capital Letters as differenced
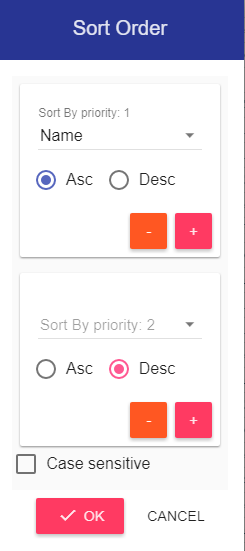
Note: you have up to 3 columns to sort by, clicking on the “+” Sign will add another sorting column, as the priority is set to be the first as the first priority in sorting up to the last, the “-“ Sign removes that sorting option.
Rearrange
In order to rearrange the columns displayed in the resulting table, left click on the header and drag it where you want it to be.
![]()
Saving
Saving can be done in two modes in the system, it’s according to what the B2Win Suite is implemented to work with Multiple Customization or One customization per report, admin can change this setting from Settings page in B2Win Suite (More in Implementation Manual)
By default, the system is configured without the multi-design, that means you can only have one report customization for each report.
Report level
For report level saving, when you click on save the customization will be saved to the report itself, then any user open the wizard for this report will have the same customization that been saved.
Multi-Design
When the system is working in multiple Customization/Designs mode, if you click on save for the first time a dialog will appear like this:

If you click on save the second time it will remember the last action you did, and save the changes to the last chosen customization.
If you want to see the dialog again, you can click on Menu -> File -> Save as and choose the new action you want.
In the saving dialog, you have 2 actions:
- Update Existing Customization - You need to select from the below list what customization you want to override and save your changes in.
- Update Report Default - Updates the report main customization, that will cause the default customization to be used when you convert a report.
- Create new Customization - Create a new customization you need to fill the new customization name.
Menu Help Tab
Manual
Open the manual PDF inside the browser where you can view all the pages of the manual.
Hot Keys
For plenty of actions inside the Wizard you have hot keys to perform these actions with the keyboard, clicking on Hotkeys from inside the menu -> Help will open a frame where you can view all the hot keys.
About
Open a page where you can see all the current configuration and settings that have been used in the report/input you have chosen from the ERP.
You can also download a debug archive to send to B2Win Suite support when troubleshooting an issue.